COVID-19 Vaccine Dashboard
This dashboard provides information about Esperanza's vaccination efforts on the Southwest Side of Chicago. Please note that, at present, Esperanza continues to follow established guidelines for vaccination and is scheduling appointments for a) established Esperanza patients who are 65+ and b) established Esperanza patients who are 1B essential workers.
Esperanza is also participating in the City of Chicago's Protect Chicago Plus program that gives vaccine priority to people who reside in various target communities. The target communities that Esperanza is serving through the program are Chicago Lawn, Gage Park, Little Village, and West Englewood. Please note that vaccine supply for these communities is limited and Esperanza hopes to vaccinate more residents as additional supply is received.
COVID-19 Testing Dashboard
This dashboard gives you direct access to the data Esperanza Health Centers collects as it performs COVID-19 testing across the Southwest Side of Chicago. See what the pandemic looks like through Esperanza's eyes, or select a zip code to find out what we're observing in your neighborhood. You can also access citywide data from the Chicago Department of Public Health to compare Esperanza's numbers to the rest of the city.
The data here is published with a 7-day delay to allow our laboratory to process and deliver all test results back to Esperanza Health Centers. This ensures that the data you see is as complete and accurate as possible.
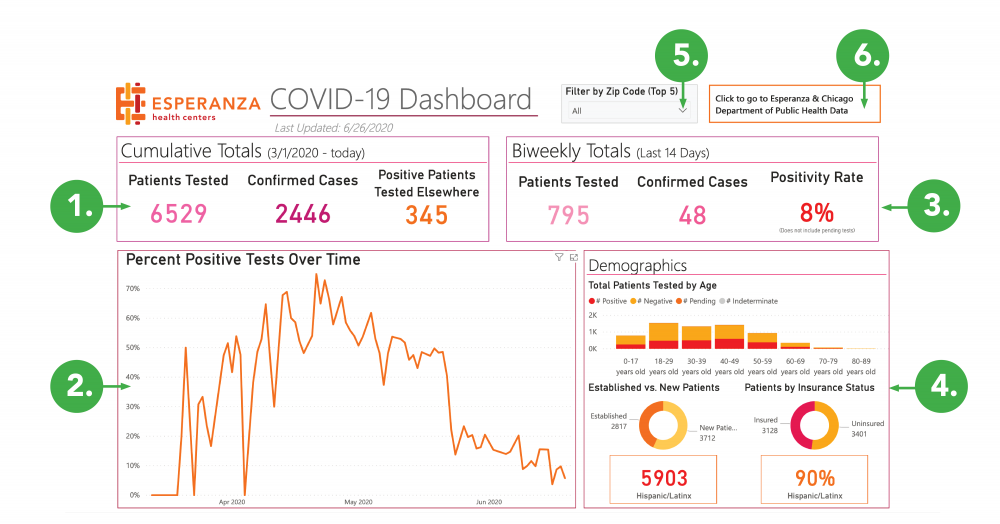
How to use this dashboard
Esperanza's COVID-19 tracking dashboard gives you:
1) The total number of unique patients tested for COVID-19 at Esperanza since March 13, 2020 as well as the total count of unique patients who tested positive.
2) Information on positivity trends since Esperanza began testing on March 13, 2020. To see the positivity rate on a specific date, simply place your cursor anywhere along the trend line.
3) Most recent positivity data recorded during the previous two weeks (14 days). The positivity rate is calculated by the number of positive tests divided by the number of positive tests plus the number of negative tests.
4) Demographic data for people tested at Esperanza. Place your cursor over the bar graphs or pie chart to see more data.
5) The ability to get current Esperanza COVID testing data for five zip codes on Chicago's Southwest side (60632, 60623, 60609, 60629, 60608).
6) A link to compare Esperanza's positivity trend with data from the Chicago Department of Public Health.